Symmetrical Triangle broken on EURUSD, waiting on USDCHF
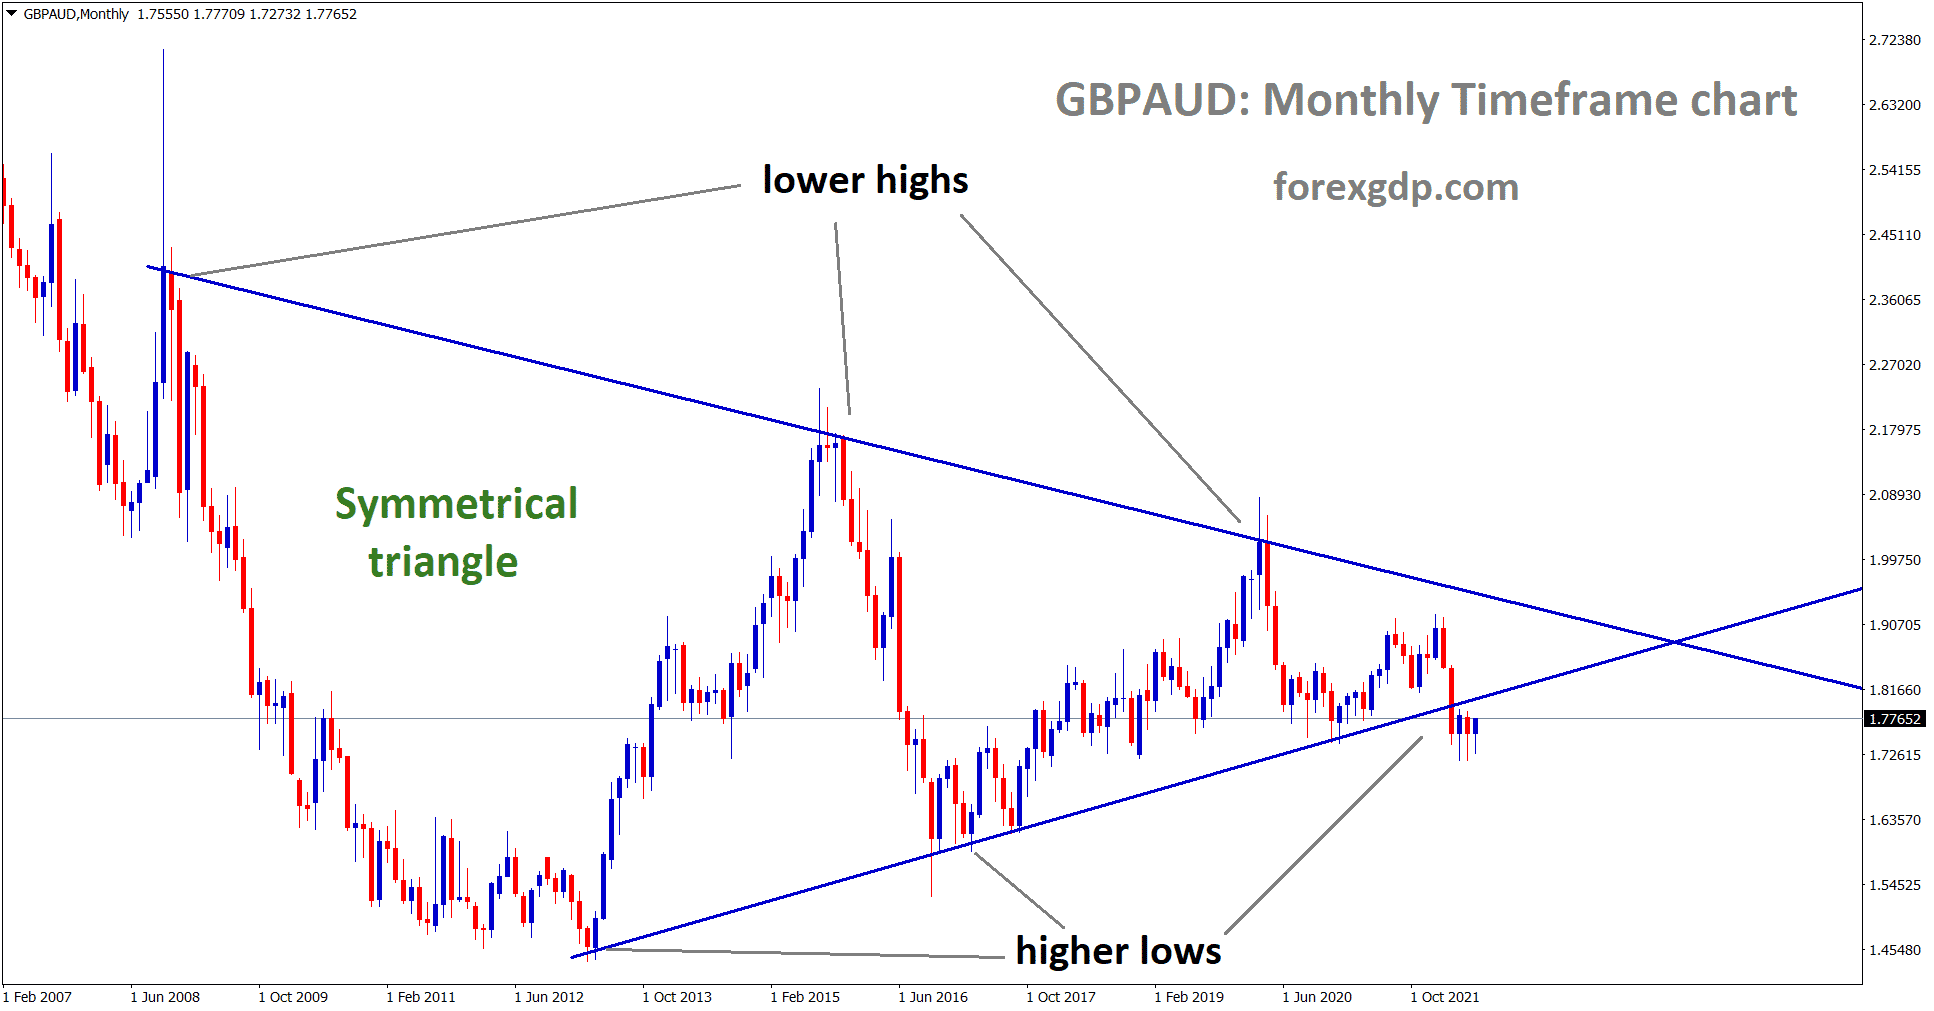
Lower Highs, Higher Lows creates a Symmetrical Triangle Pattern.
Symmetrical Triangle pattern formed on both EURUSD and USDCHF .
Long waiting Symmetrical Triangle broken on EURUSD.
A Big Bull Candlestick closed above the top zone confirms breakout in h4 chart as shown in the above chart.
But in USDCHF, Symmetrical triangle will end soon.
Breakout will happen either upward or downward.
Let’s wait for the breakout to catch the good move on USDCHF.
I know most of you thinking about inverse correlation of EURUSD and USDCHF. but don’t trade only depend on inverse correlation.
Because the forex market sentiment has changed now due to this worldwide lock down and lack of liquidity in currencies.
However, Crude oil, Gold having huge volatility at this situation.
US CHINA fight will drive the next big move in financial markets.
Let’s stay tuned for big long term move soon. Keep following the trade signals as per the signal guidance.
Check live Free forex signals now.
To increase your trading profits, read this below topics:
How to trade profitably using Chart Patterns?
Low risk, High reward trading strategies
How to get rich trading forex market?
Most predictable Currency Markets
If you want to learn more successful trading techniques with free mentorship support, you can purchase the forex trading video course.
Thank you.


Pingback:+750 points profit in EURUSD Buy trade after triangle breakout | FOREX GDP
remarkable analysis