Latest Trading News and Chart Analysis
Gold falls down 130$ in 2 days from 2070 to 1940
US Dollar Analysis for Gold and USDJPY US Dollar becomes strong for correction as Gold fall down 130$ in 2…
read more....Old Resistance acts as New Support in NZDUSD
NZDUSD Support Analysis NZDUSD is moving up and down between the Resistance and Support zones for a long time. NZDUSD…
read more....EURUSD Uptrend Rally going to start soon after this breakout
In Weekly Time-frame Chart, Since from the year 2008, EURUSD is moving in a downtrend by forming Lower highs, lower…
read more....Secret Forex Indicator
Nowadays, you can see a lot of advertisements on secret forex indicators that help you to turn 100$ to 10,000$…
read more....USDCHF starts to bounce back from a higher low of Uptrend Line
USDCHF Technical Analysis USDCHF is moving in an Uptrend by forming higher high, higher low in 1-hour time frame chart.…
read more....RBA announcement: AUDUSD and AUDNZD at a higher low of Uptrend
AUDUSD and AUDNZD Trendline Analysis Both AUDUSD and AUDNZD is moving in an Uptrend forming higher highs, higher lows. Now,…
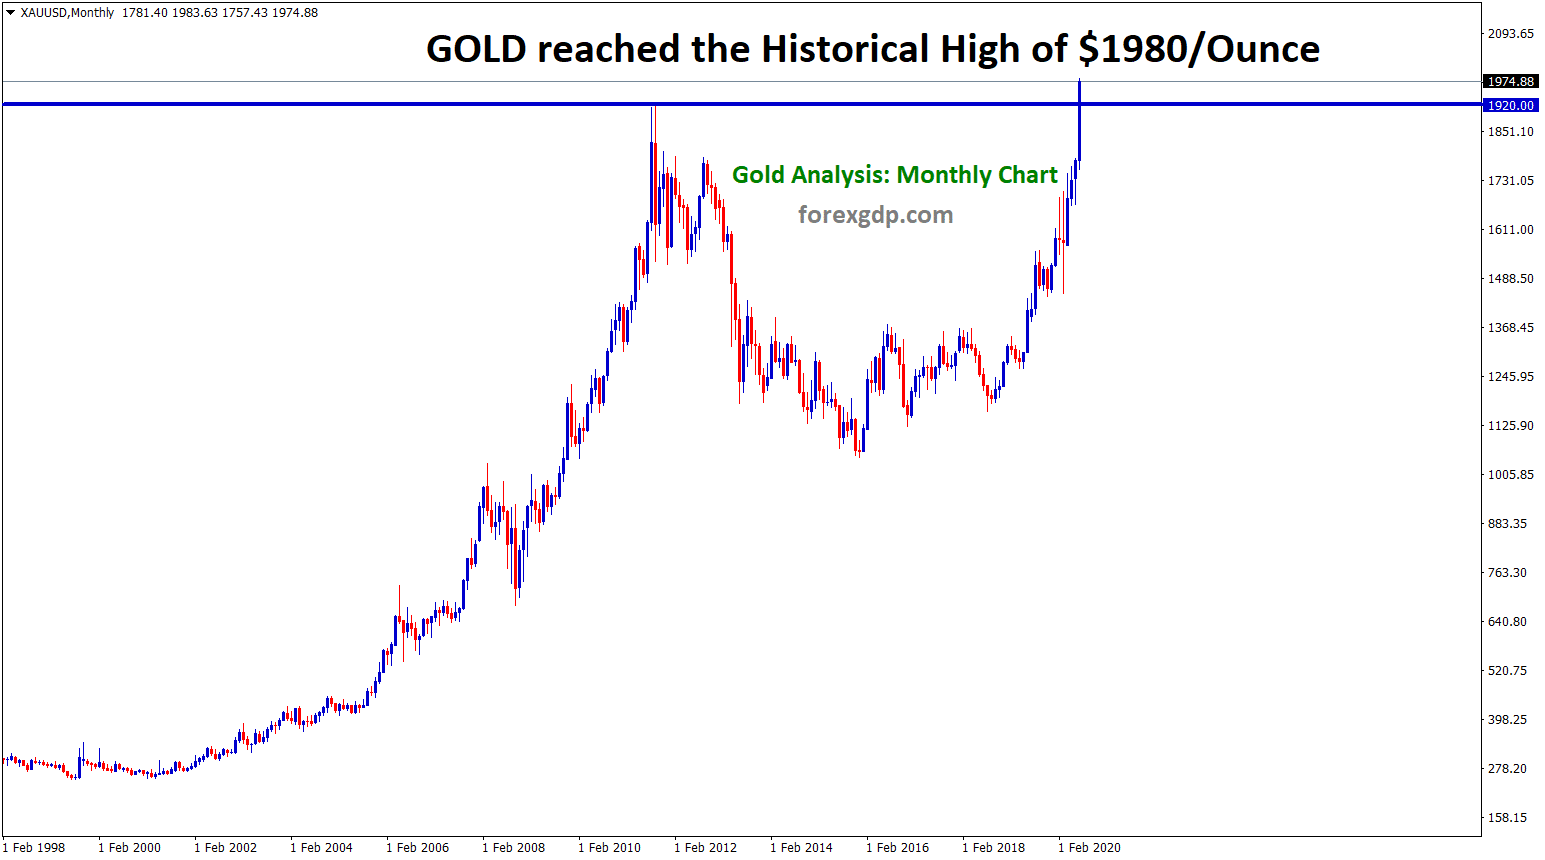
read more....Gold going to break the Historical High?
Gold Breakout Analysis Gold has raised to the historical high of $1980/Ounce. It has crossed the $1920 high created in…
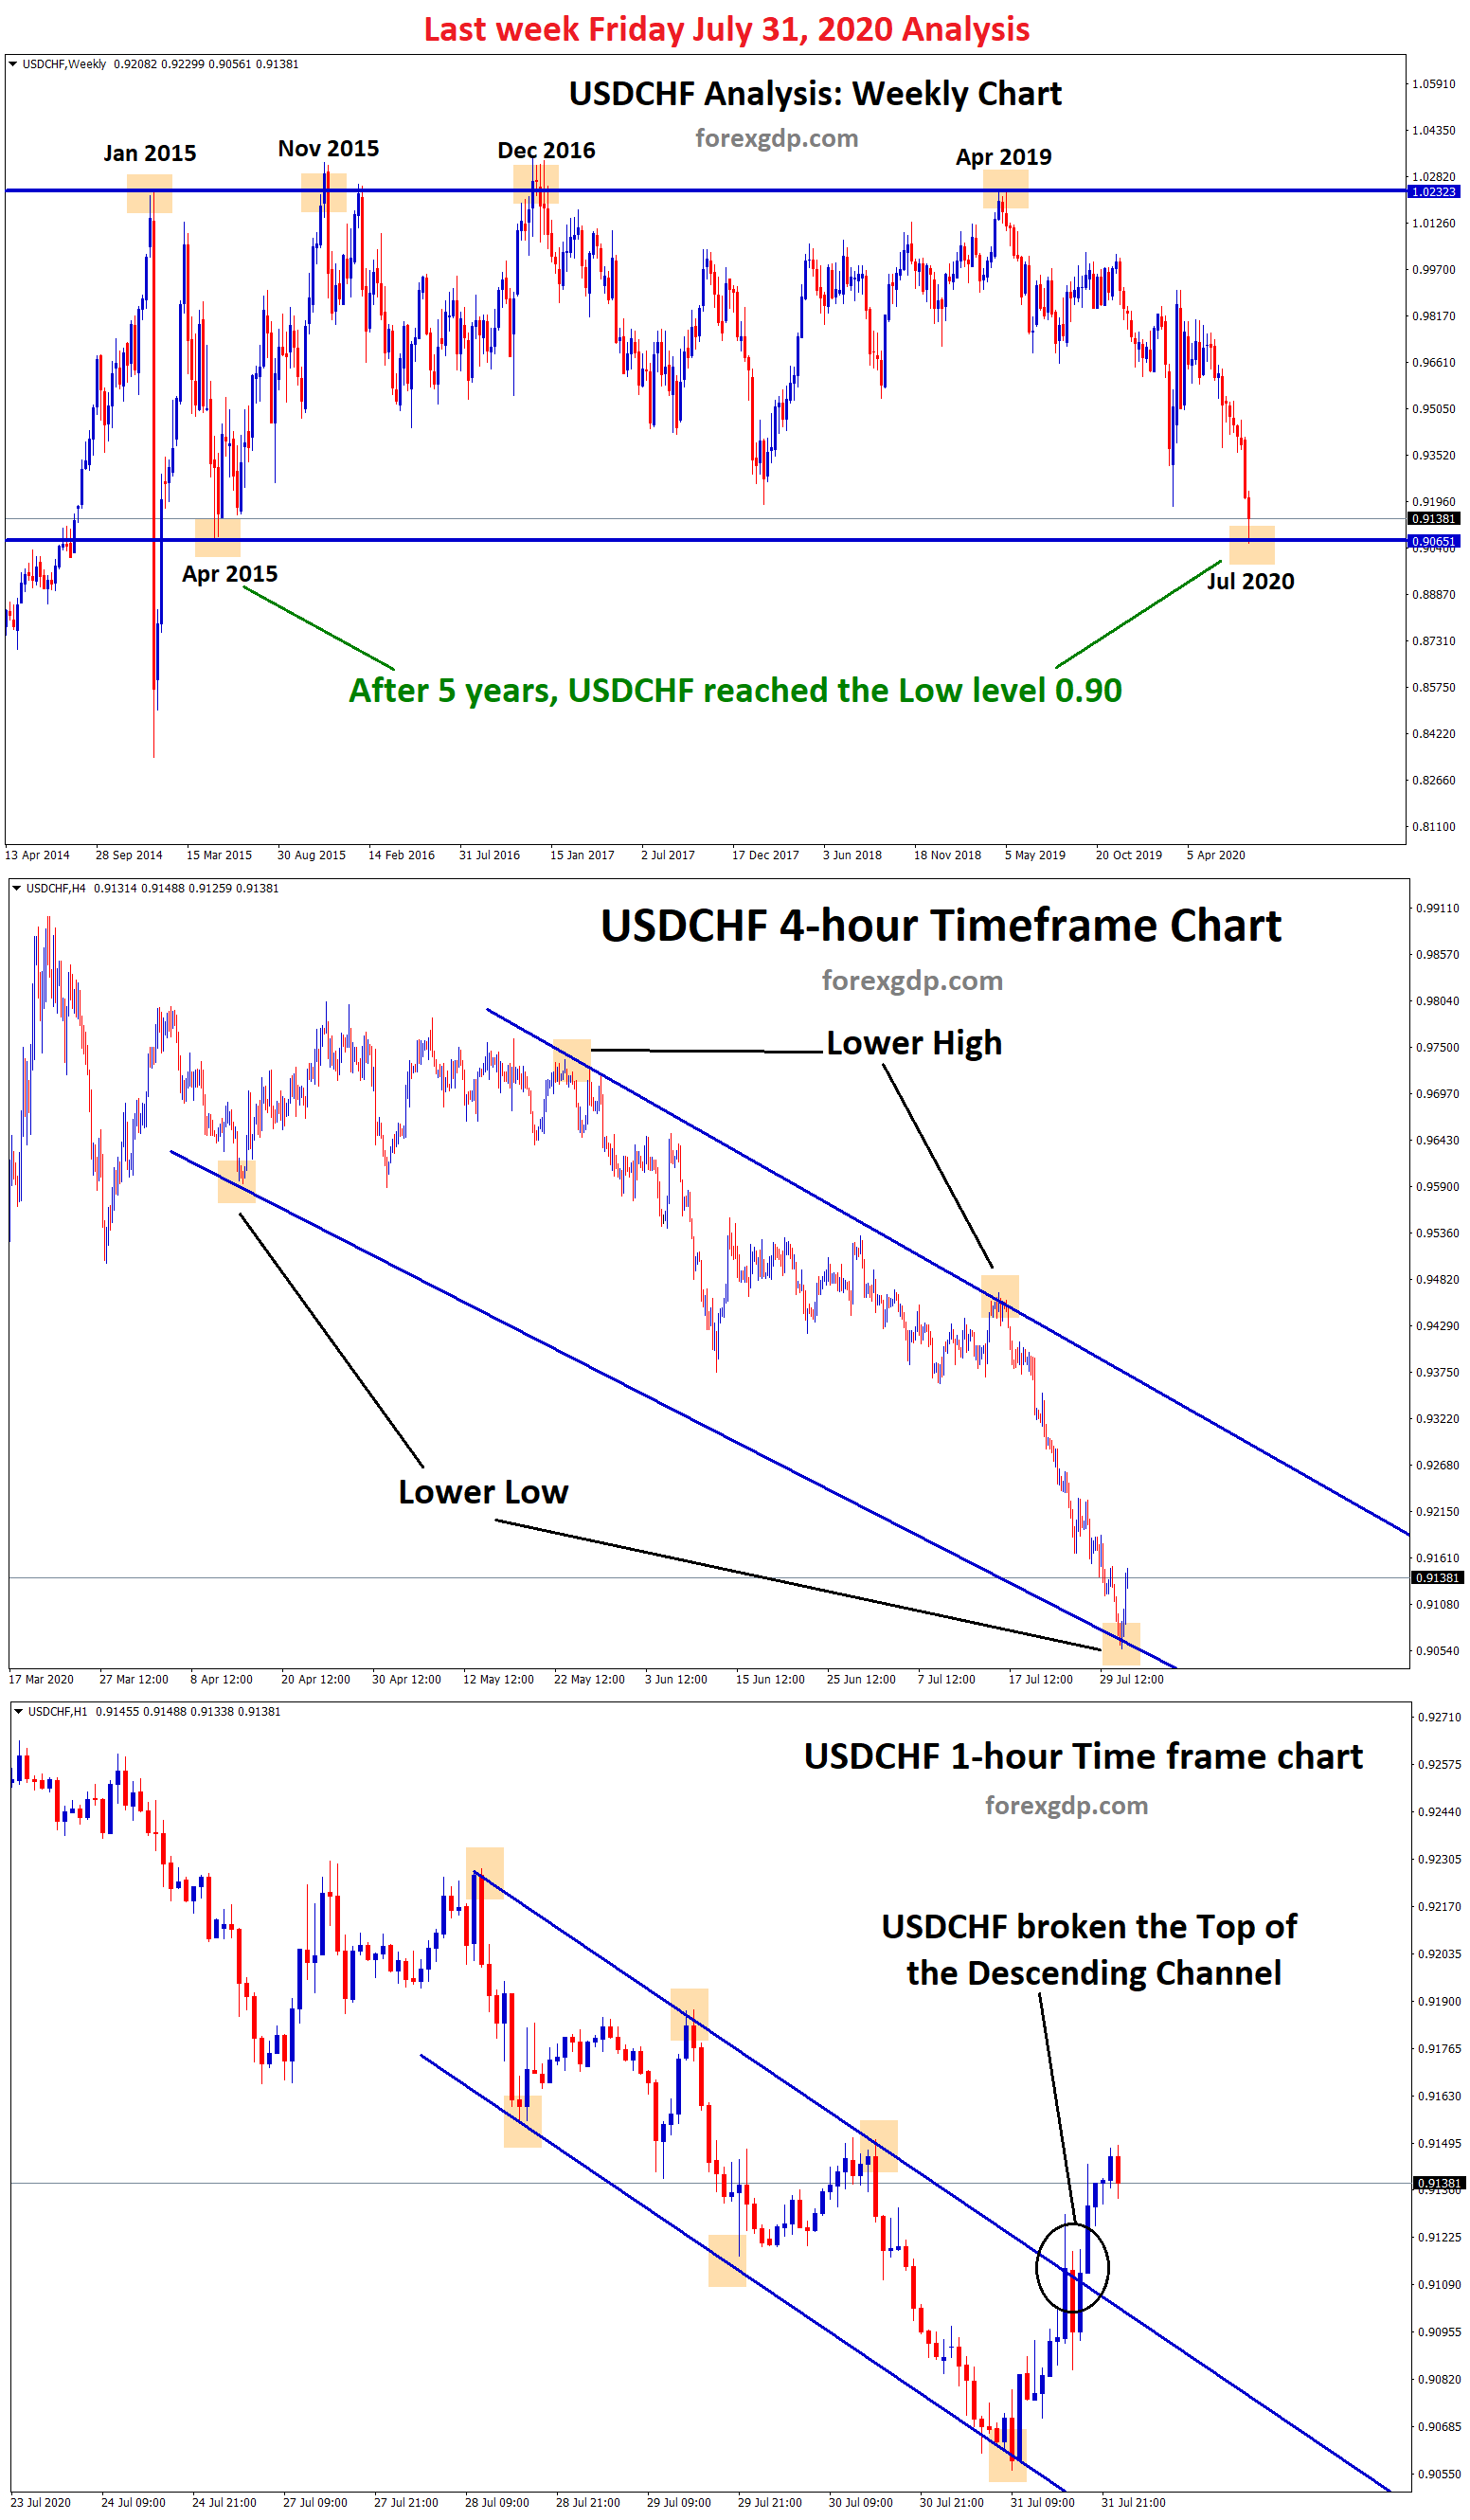
read more....After 5 years, USDCHF reached the Low Price 0.90
USDCHF Full View Analysis Since from 2015, USDCHF is moving up and down between specific price ranges for a long…
read more....US Dollar getting weak Continuously
USDJPY Descending Triangle Breakout USDJPY formed a Descending Triangle Pattern by creating lower highs, equal lows. Recently, USDJPY has broken…
read more....Gold Reached the Historical High After 9 Years
Today (July 27, 2020) Gold has reached the Top Most Price Level $1920/Ounce. On the year September 2011, Gold reached…
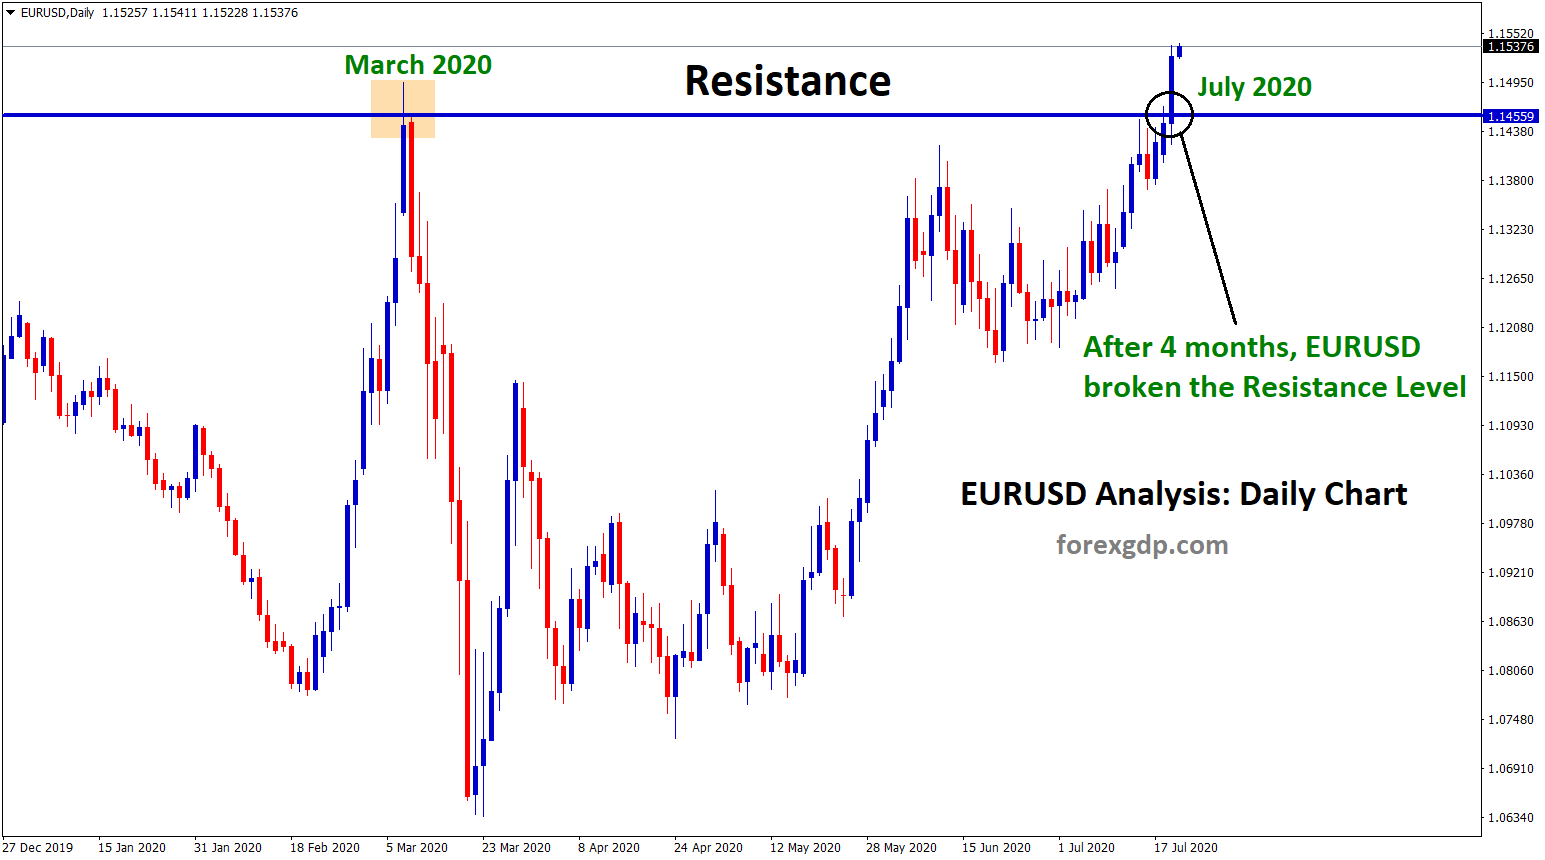
read more....After 4 months, EURUSD broke the Resistance
EURUSD Resistance Breakout Analysis After 4 months, EURUSD has broken the resistance zone Steadily with buyers pressure. Due to recovery…
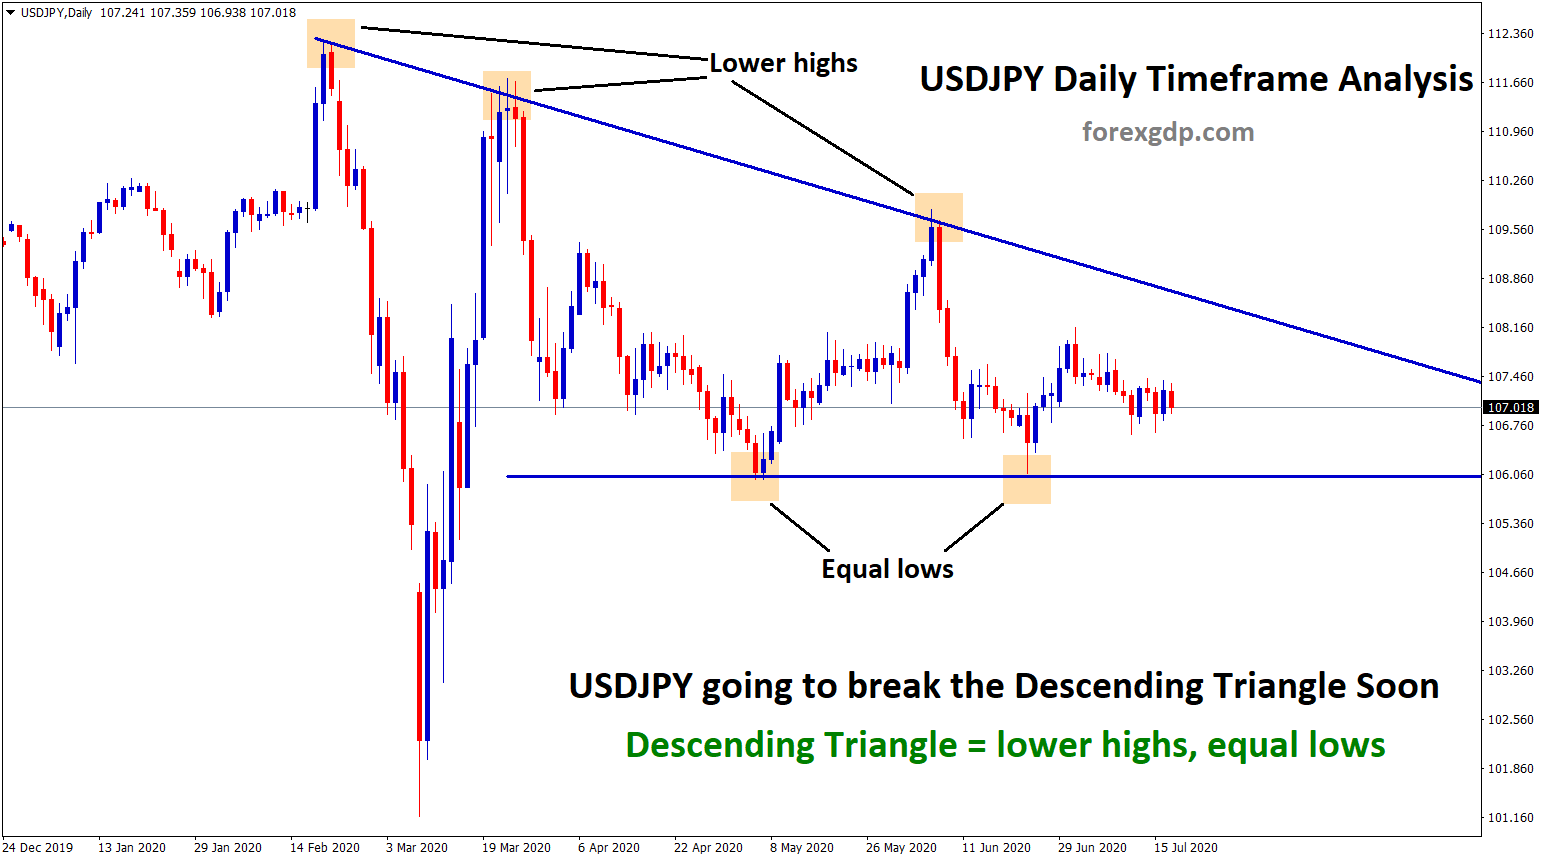
read more....USDJPY going to break the descending Triangle Soon in D1
Waiting for Breakout in USDJPY USDJPY formed a descending triangle pattern by creating lower highs and equal lows. The Descending…
read more....


