Author: FOREX GDP
-
Crude Oil retest the breakout level of descending Triangle
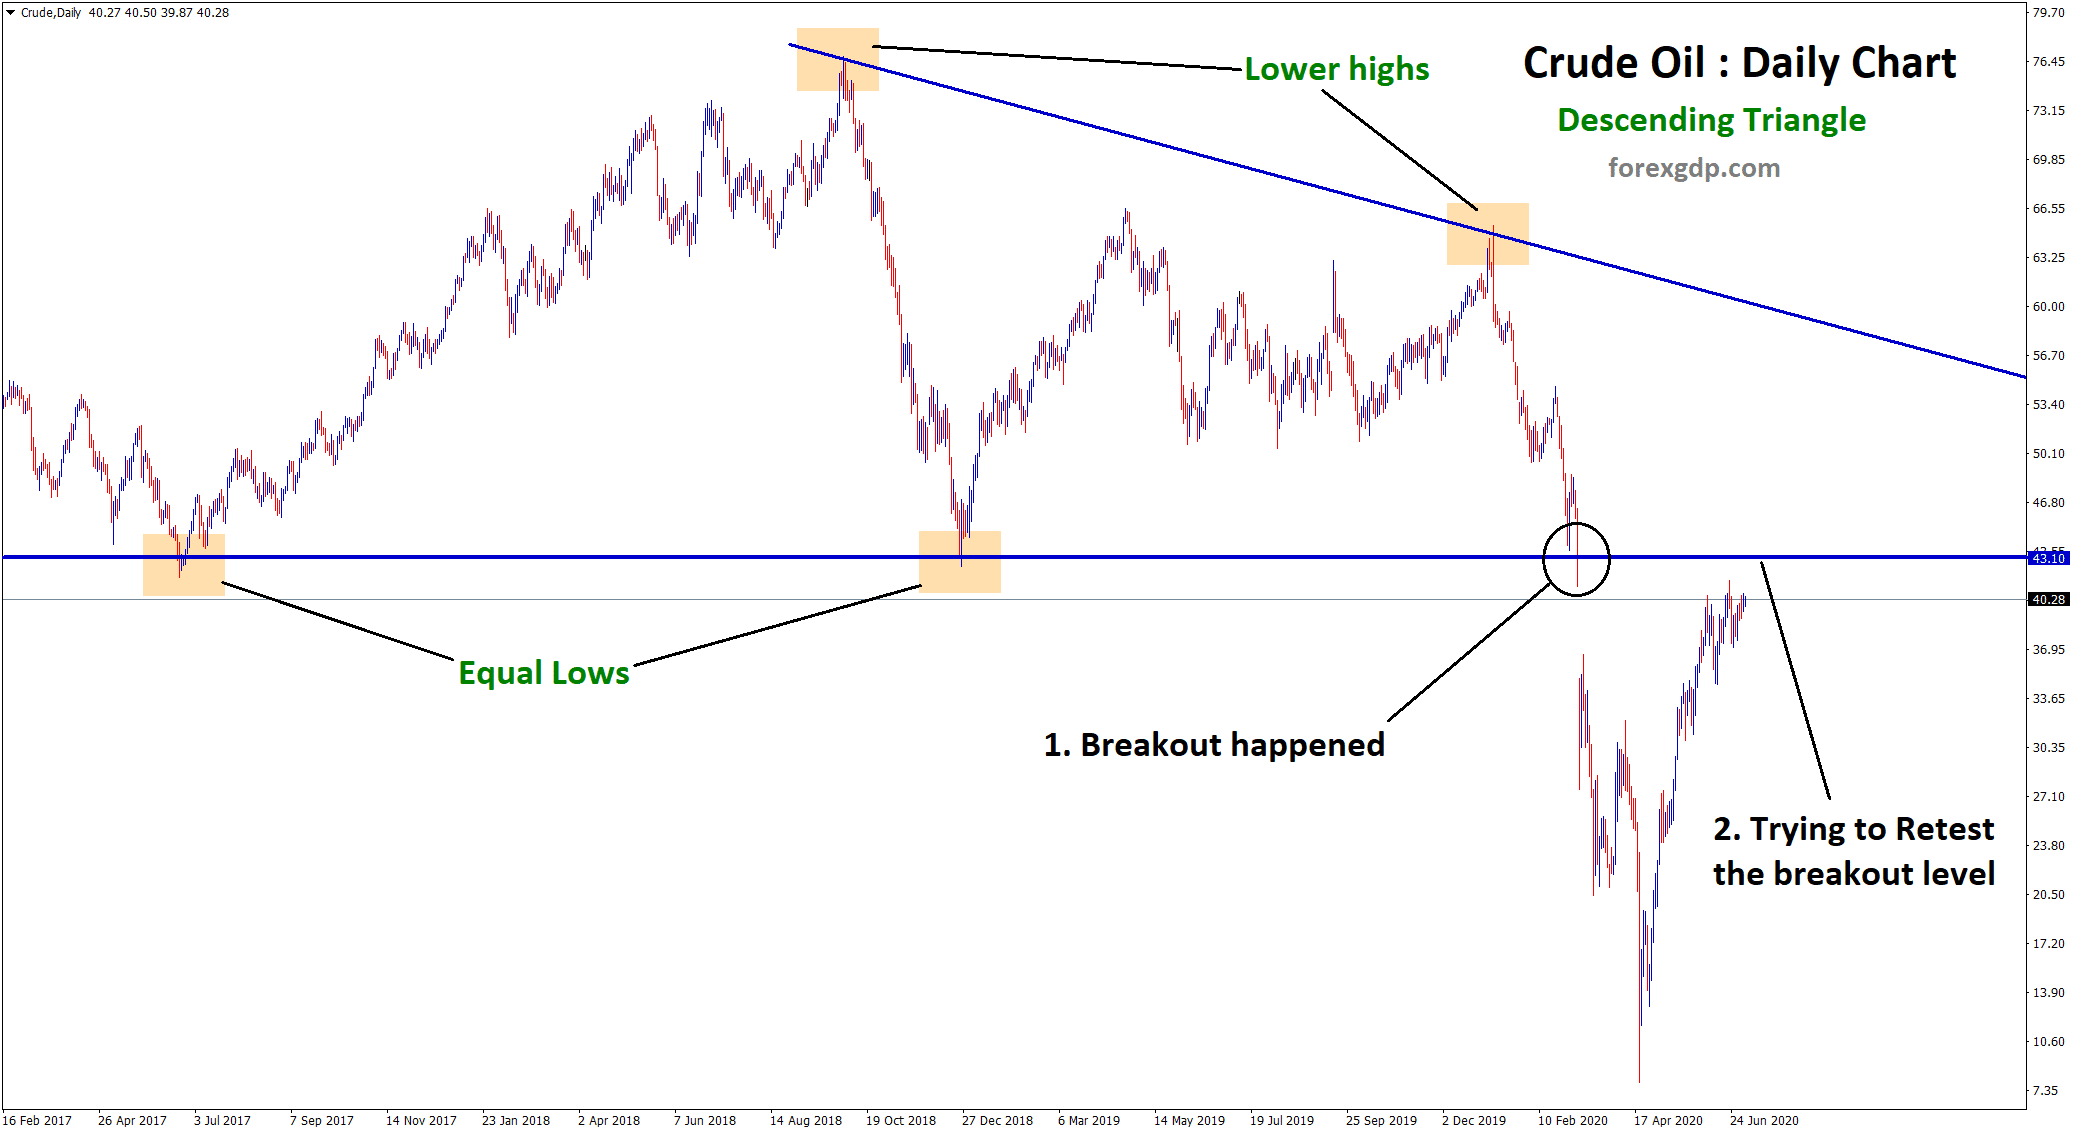
Crude Oil Price Chart Analysis Crude oil has recovered from the historical fall and trading now around $40 per barrel.…
-
USDJPY standing now at a higher low of Uptrend line
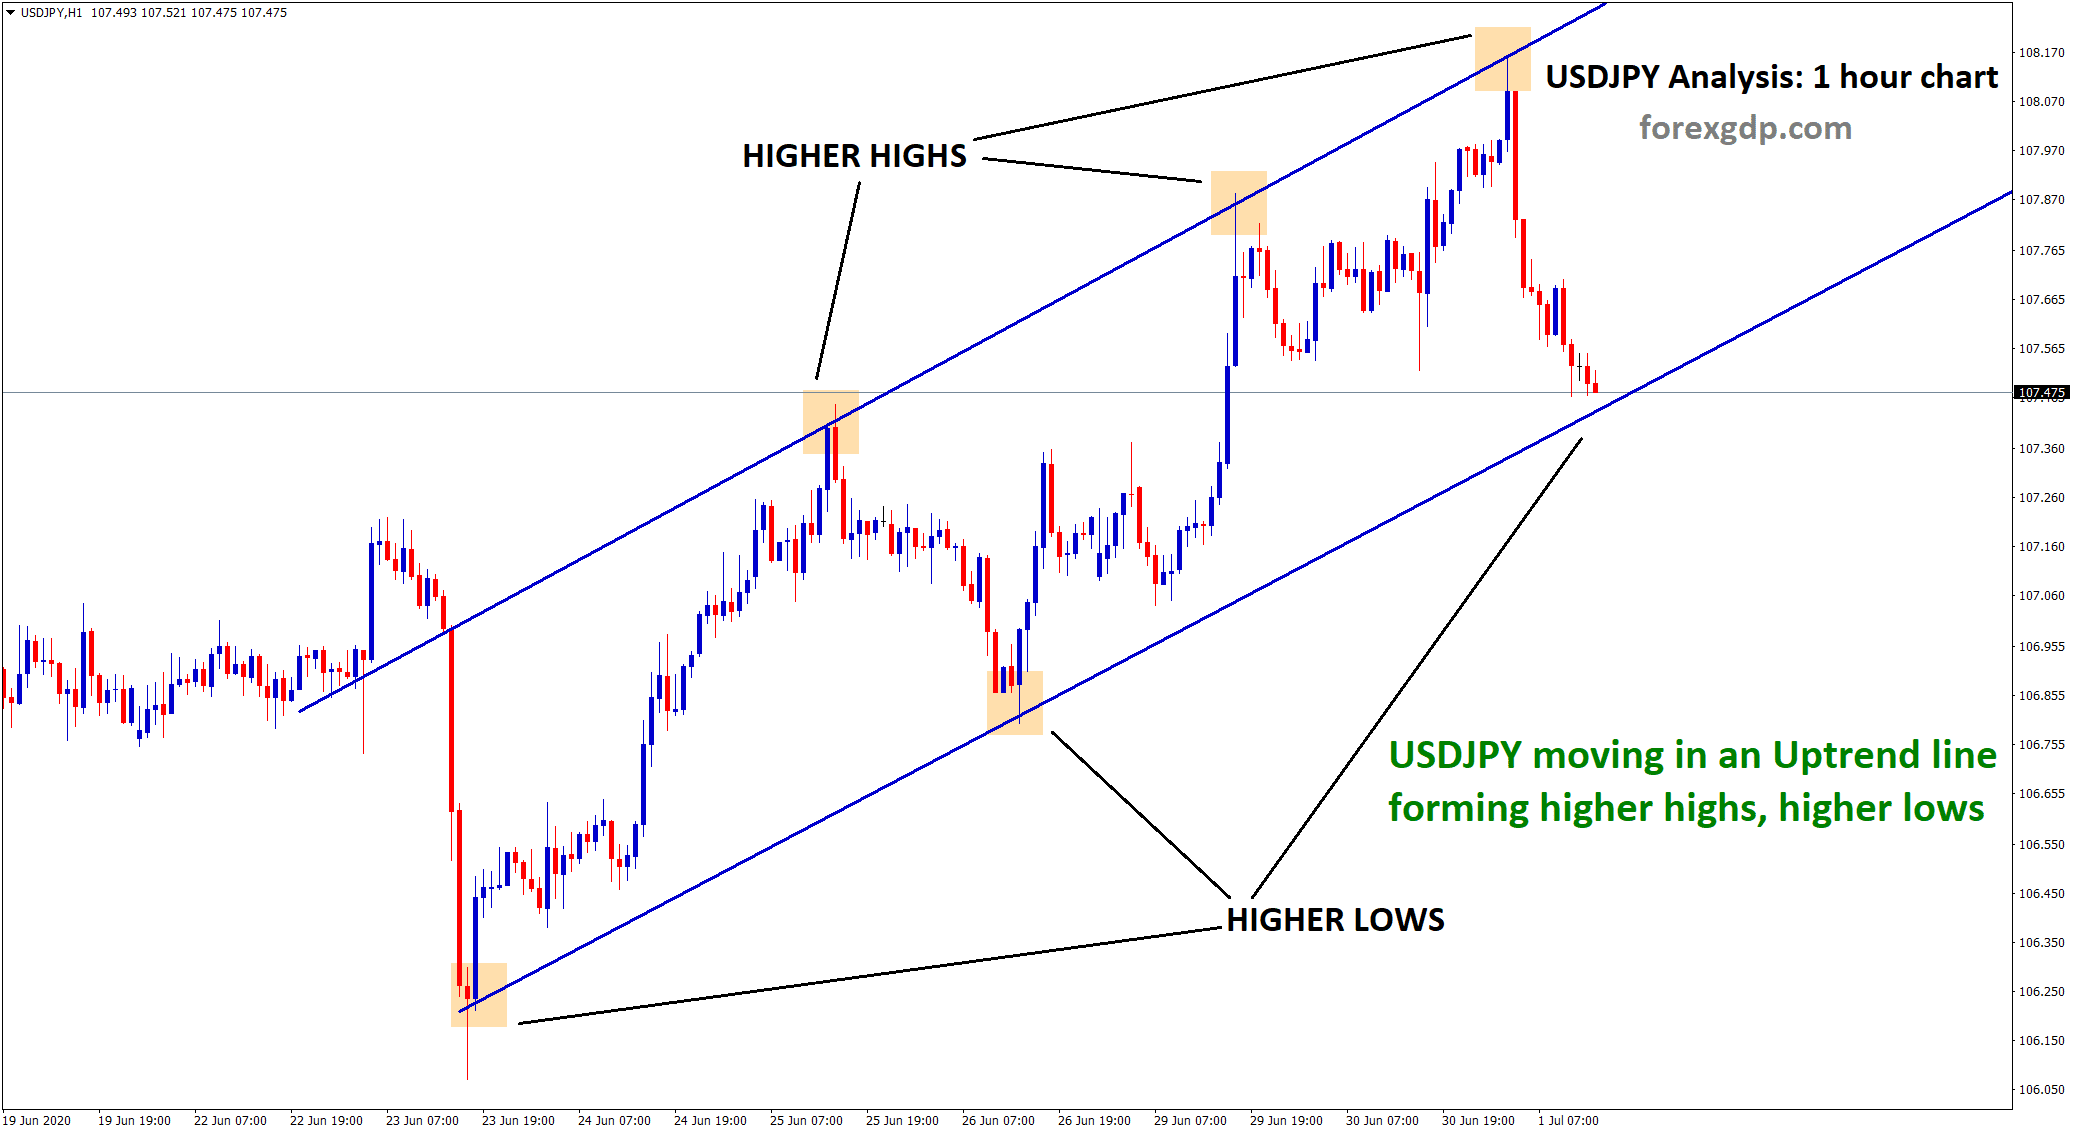
USDJPY retracing in Uptrend In 1 hour chart, USDJPY moving in an Uptrend line forming higher highs, higher lows. Now,…
-
2nd Wave of Covid-19 rapidly increasing, FOMC meeting, Chinese PMI data risk

Wall Street ended in a higher note on Monday, DOW JONES closes at 2.32%, S&P 500 at 1.47%, and NASDAQ…
-
Gold flying higher high after a breakout at 1760

This week Gold broke the recent top price level 1760 and reached a high of 1780$ per ounce. Technically, XAUUSD…
-
Old Resistance act as a New Support in EURCHF

EURCHF Support Resistance Analysis EURCHF broke the resistance level in the previous month. Again the market came back to retest…
-
BOE boost QE by 100bn, India China war strengthens USD

Bank of England left interest rates unchanged at 0.1% and increased its QE bond-buying program by GBP100 billion for supporting…
-
Coronavirus returns affecting the markets 2nd time.

Crude oil prices declined, due to risk aversion of Covid-19 and sell-off among financial markets worldwide. Crude oil starts to…
-
USDJPY moving in a downtrend

USDJPY Descending Channel Analysis USDJPY is moving in a downtrend by forming lower highs, lower lows in Weekly Chart. Since…
-
Forex GDP launched Officially in Telegram

Welcome to Forex GDP Telegram! Today, we officially launched our Telegram Channel. Join Free now t.me/forexgdp Share this link: t.me/forexgdp…
-
EURGBP raised Up due to FED outcome

EURGBP Descending Triangle breakout EURGBP broke the strong resistance zone recently after 45 days. Now the old resistance zone act…
-
FOMC today – Gold at Resistance, USDJPY broken Triangle

Gold is moving in a downtrend by forming lower highs, lower lows in 4-hour chart. Now the market is going…
-
AUDJPY Resistance Reversal in Daily Chart?

AUDJPY Falling from the Resistance Zone AUDJPY is moving up continuously for long time without much corrections. Now, AUDJPY Starts…
-
GBPUSD broke the top levels in Ascending Triangle and Trendline

GBPUSD Ascending Triangle pattern GBPUSD formed Equal highs, higher lows in 4-hour chart which creates an Ascending Triangle pattern. Recently…
-
AUDNZD forming higher highs higher lows
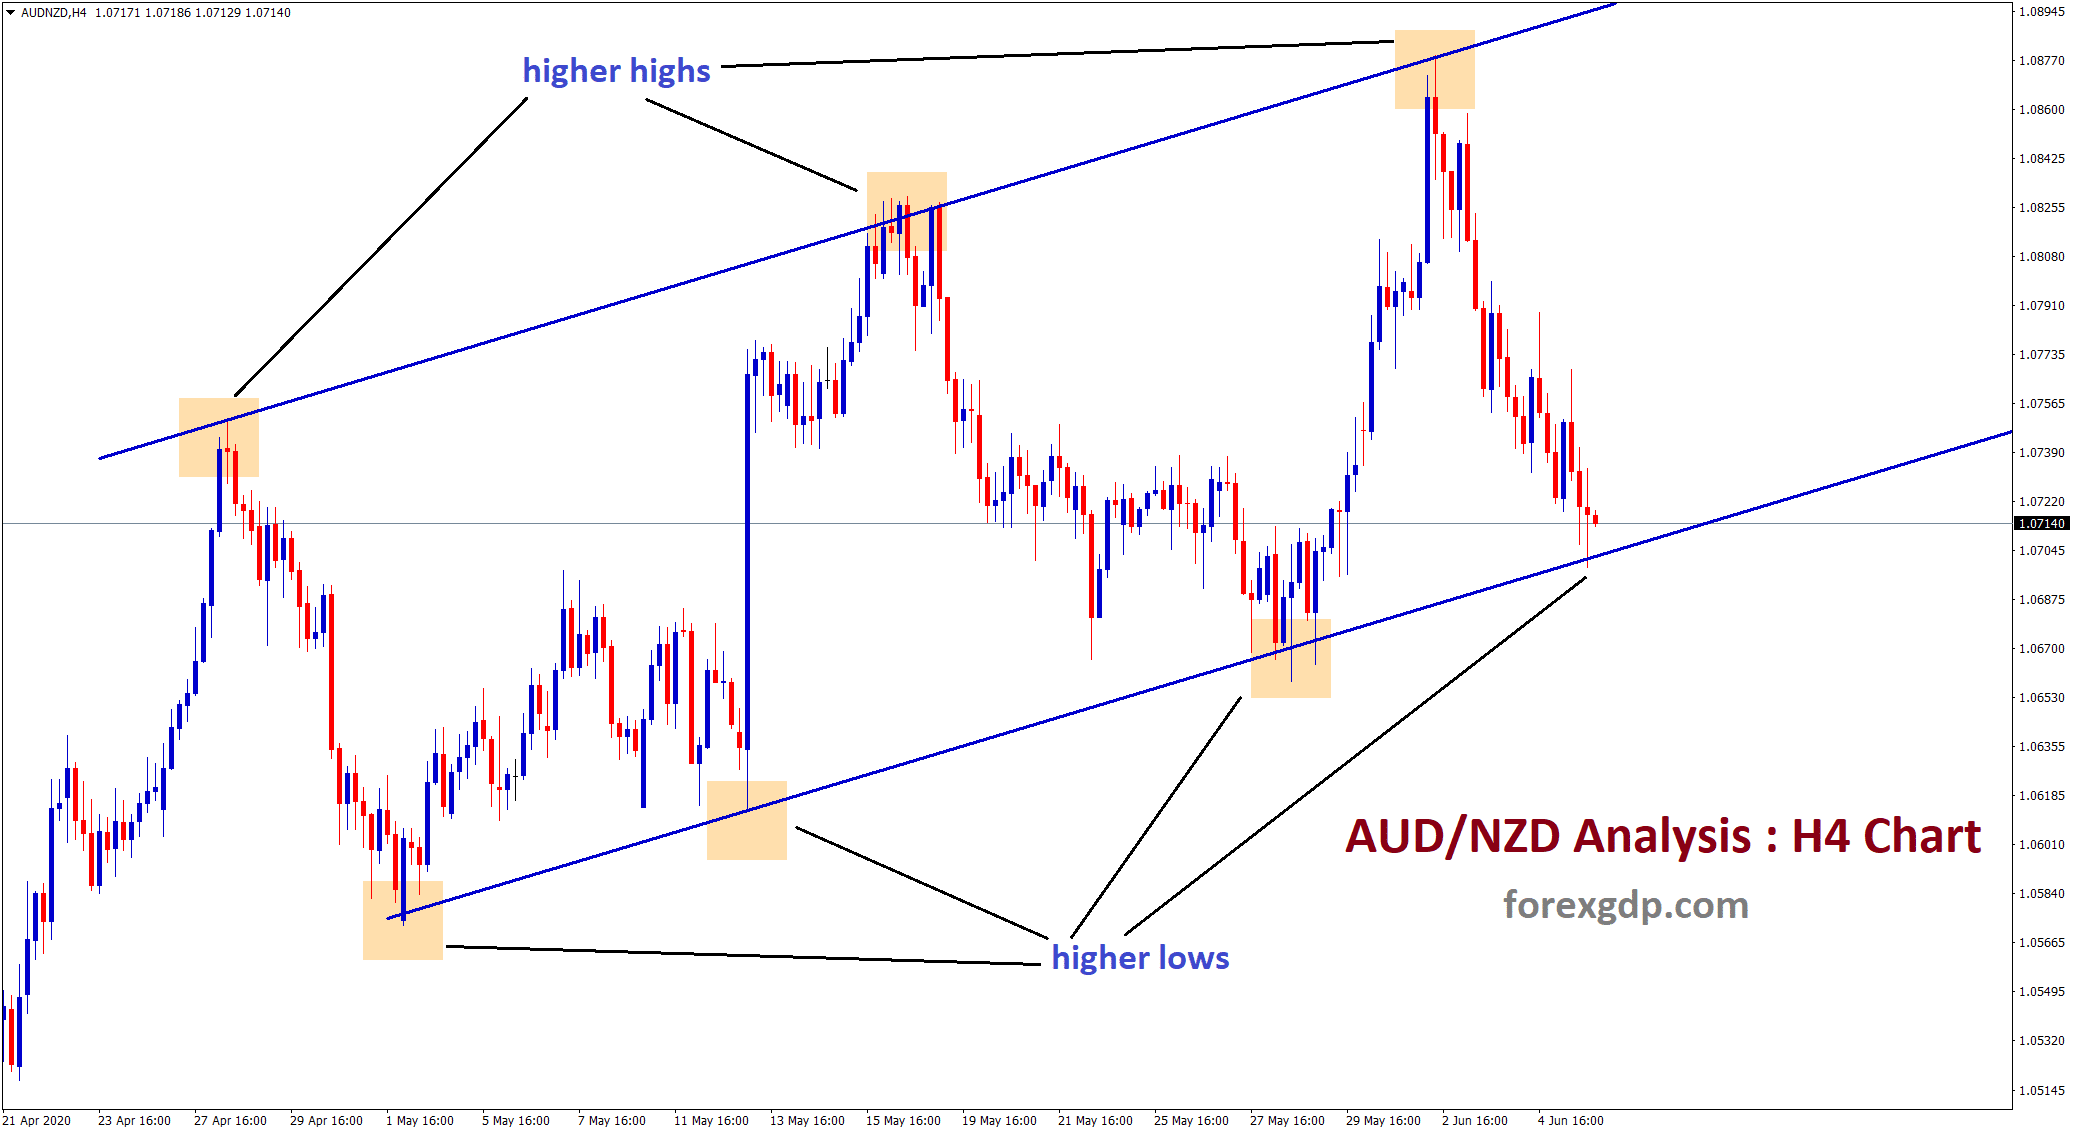
AUDNZD Up Trend Line Analysis AUDNZD is moving in a strong uptrend in H4 chart. Higher high, higher low forming…
-
ECB pushing EURO higher. After 4 months, EURAUD hits the Support.
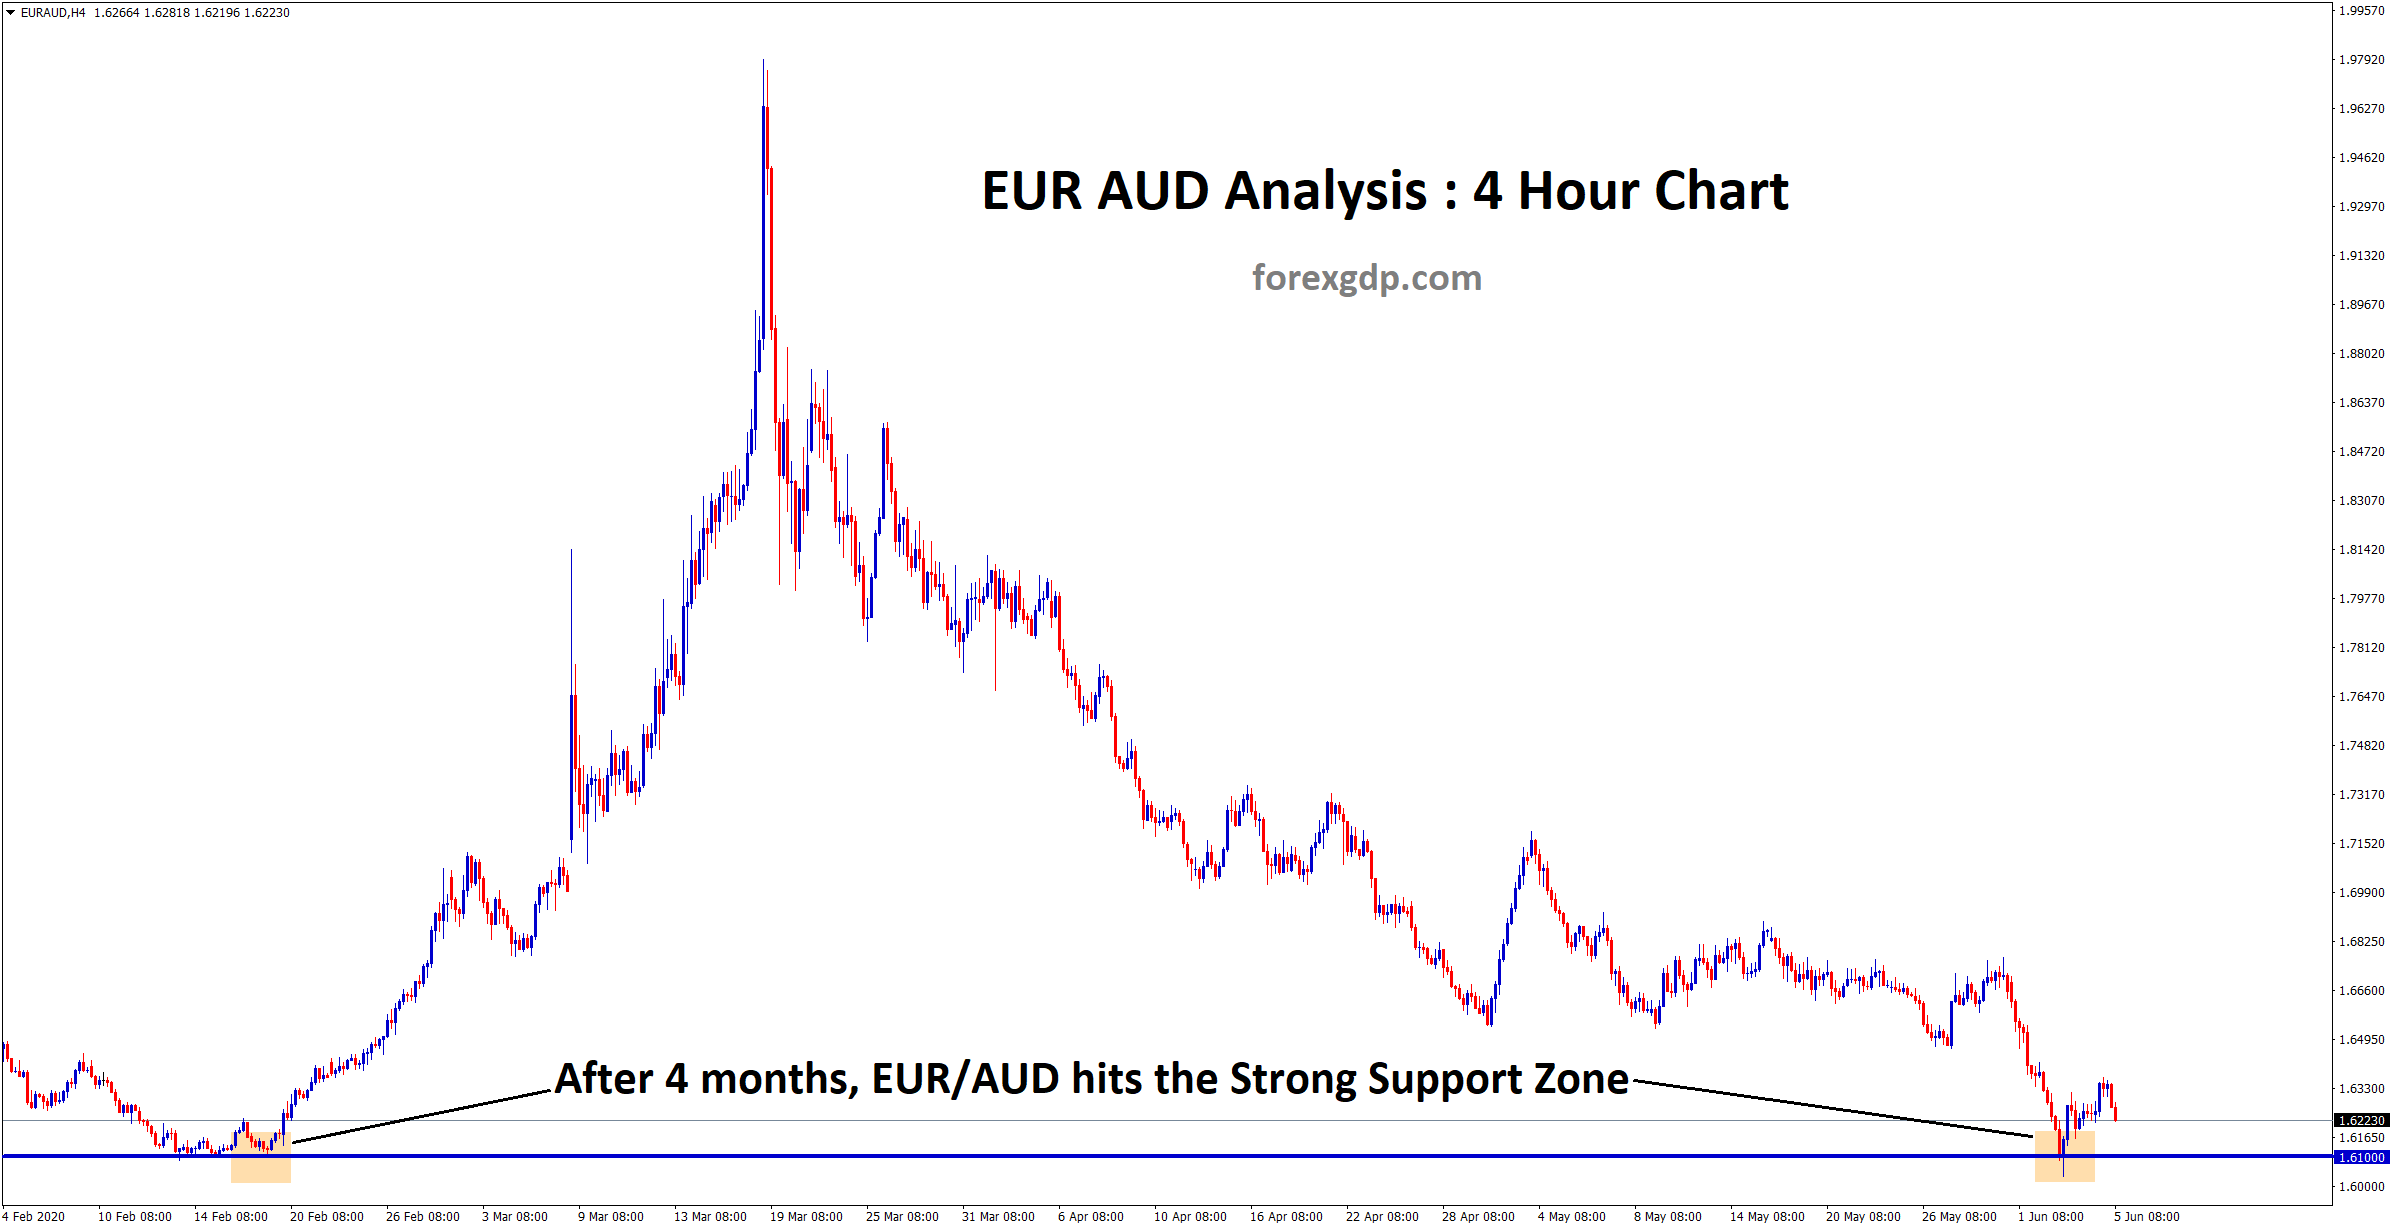
EURAUD Support Zone Analysis In 4 hour chart, EURAUD hits the strong support zone after a long time of 4…
-
EURGBP standing at the bottom level of horizontal SR and Trend line

EURGBP Support Resistance Analysis (SR Strategy) ✔️EURGBP broken the resistance level recently. After breakout, New resistance is formed. ✔️The…
-
USDCAD price fall +3448 points after breakout at Support
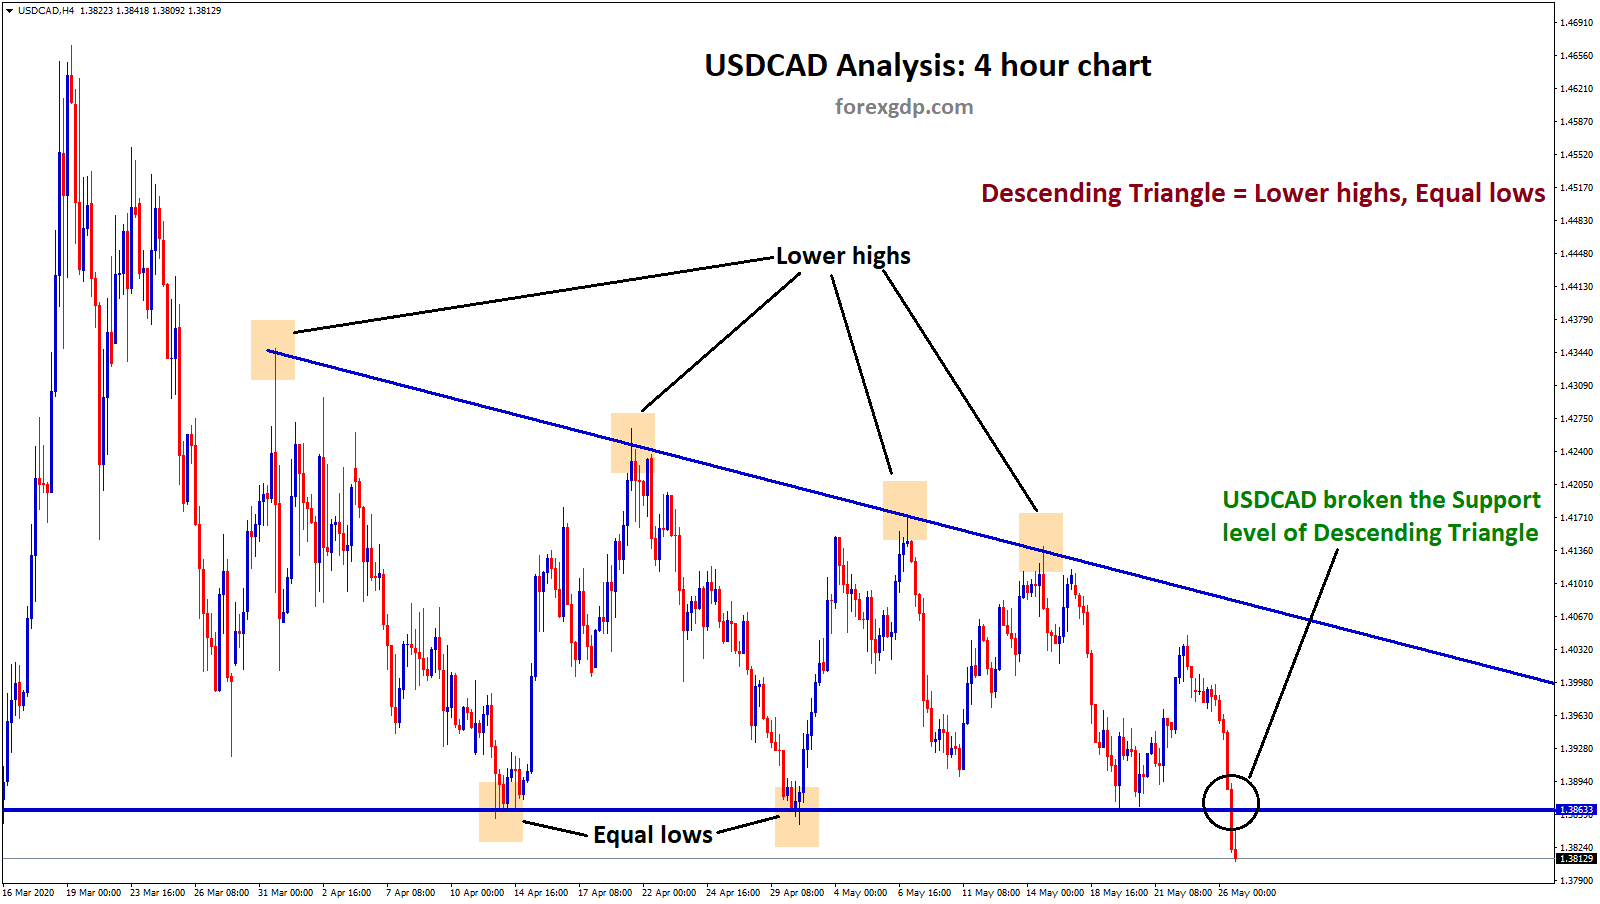
USDCAD Descending Triangle breakout Analysis USDCAD formed a Descending Triangle pattern in 4 hour chart. We wait for long time…
-
+4000 Points CADJPY Flew up after retesting breakout level
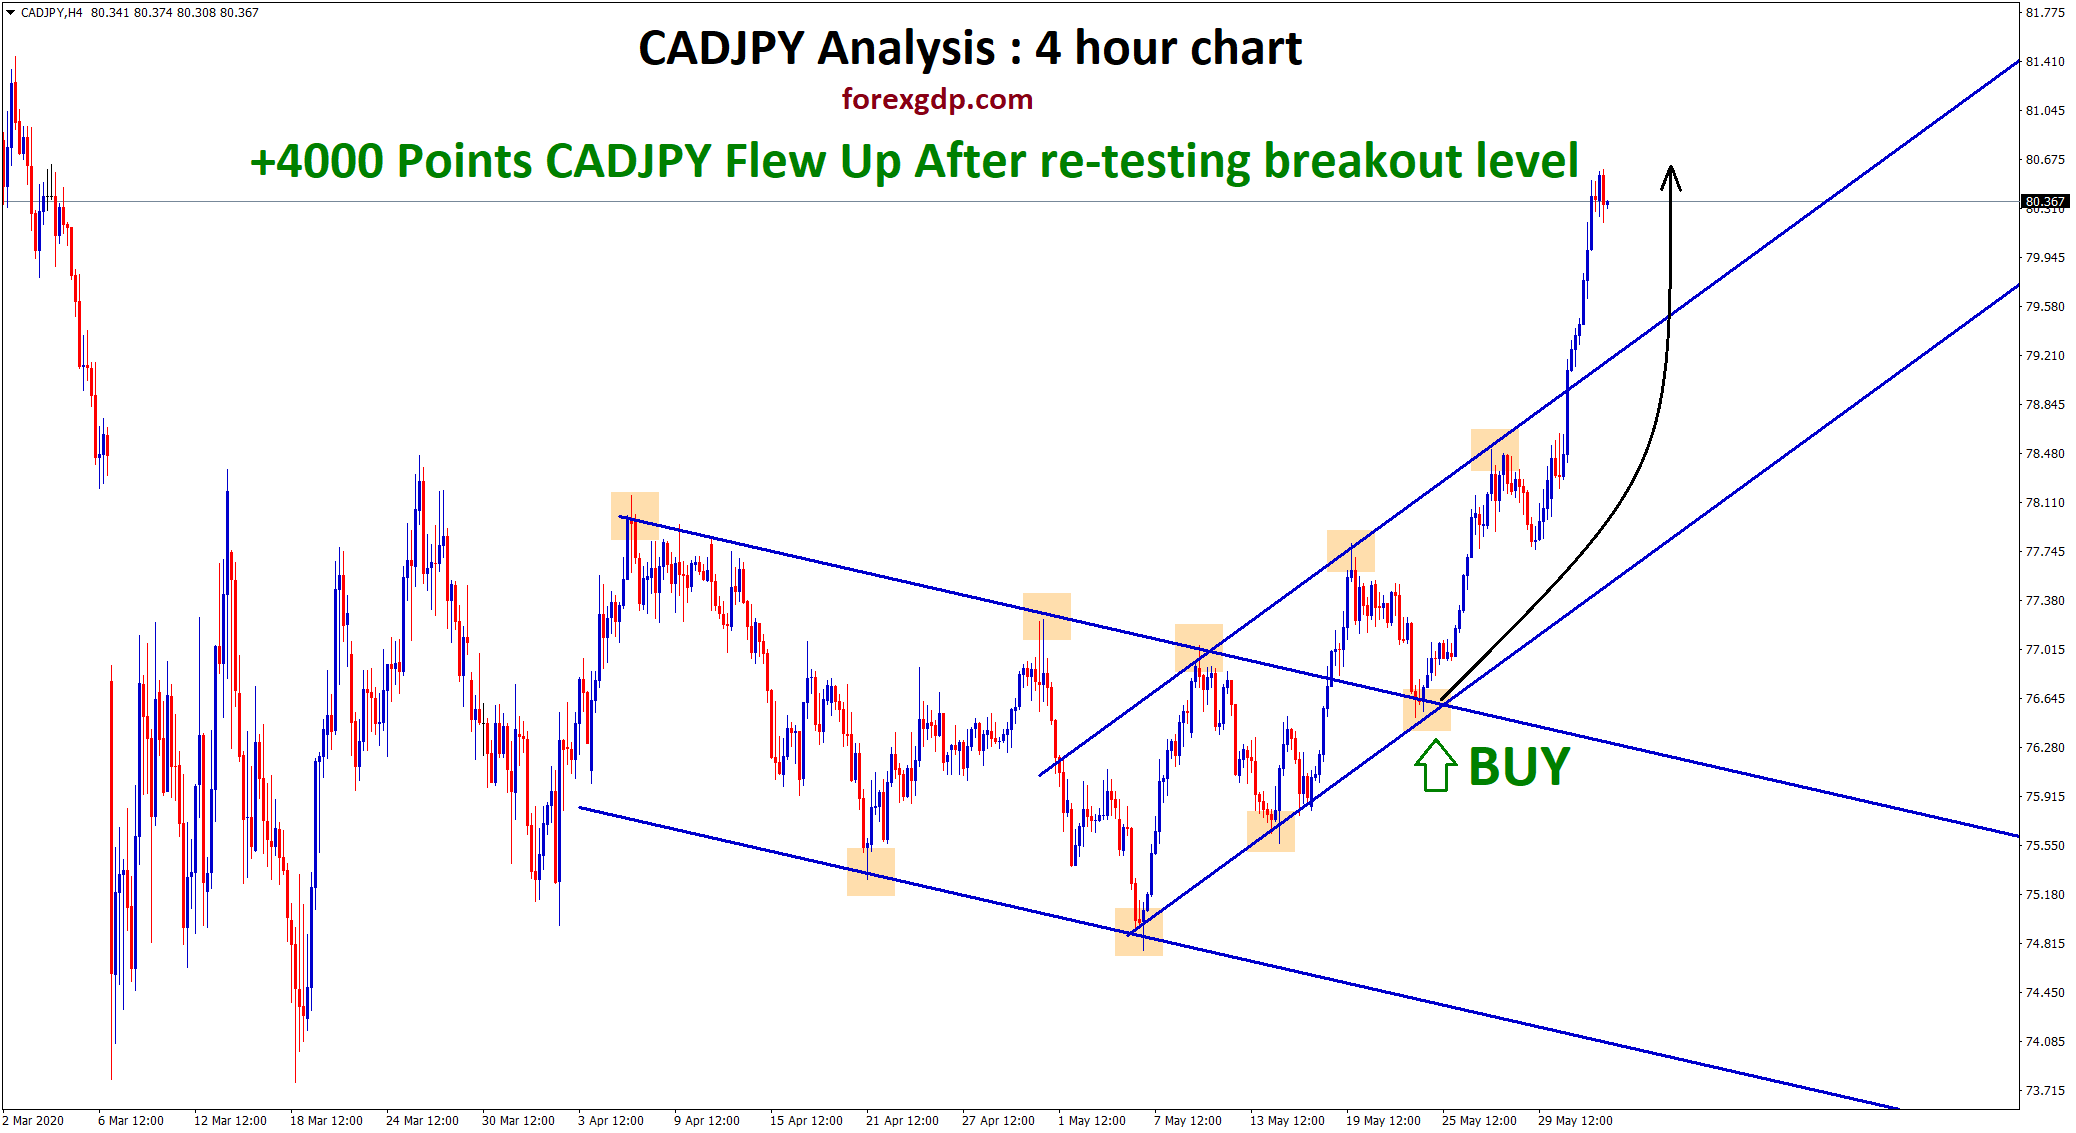
CADJPY Breakout and Retest Analysis After breakout happened at the top level, CADJPY Buy signal is given. Check the previous…
-
Symmetrical Triangle broken on USDCHF after long time

USDCHF starts to fall after a breakout We are waiting for a long time for this symmetrical Triangle breakout (check…
-
Since from 1978, EURUSD moving in an Up Trend

EURUSD History Chart Analysis From the year 1978 to till now in 2020, EURUSD is moving in an Uptrend by…
