USDJPY Technical Analysis
USDJPY reached the support zone price 104 after 2 months.
In the 4-hour time frame chart, USDJPY trying to bounce back from the support zone.
Channel Breakout
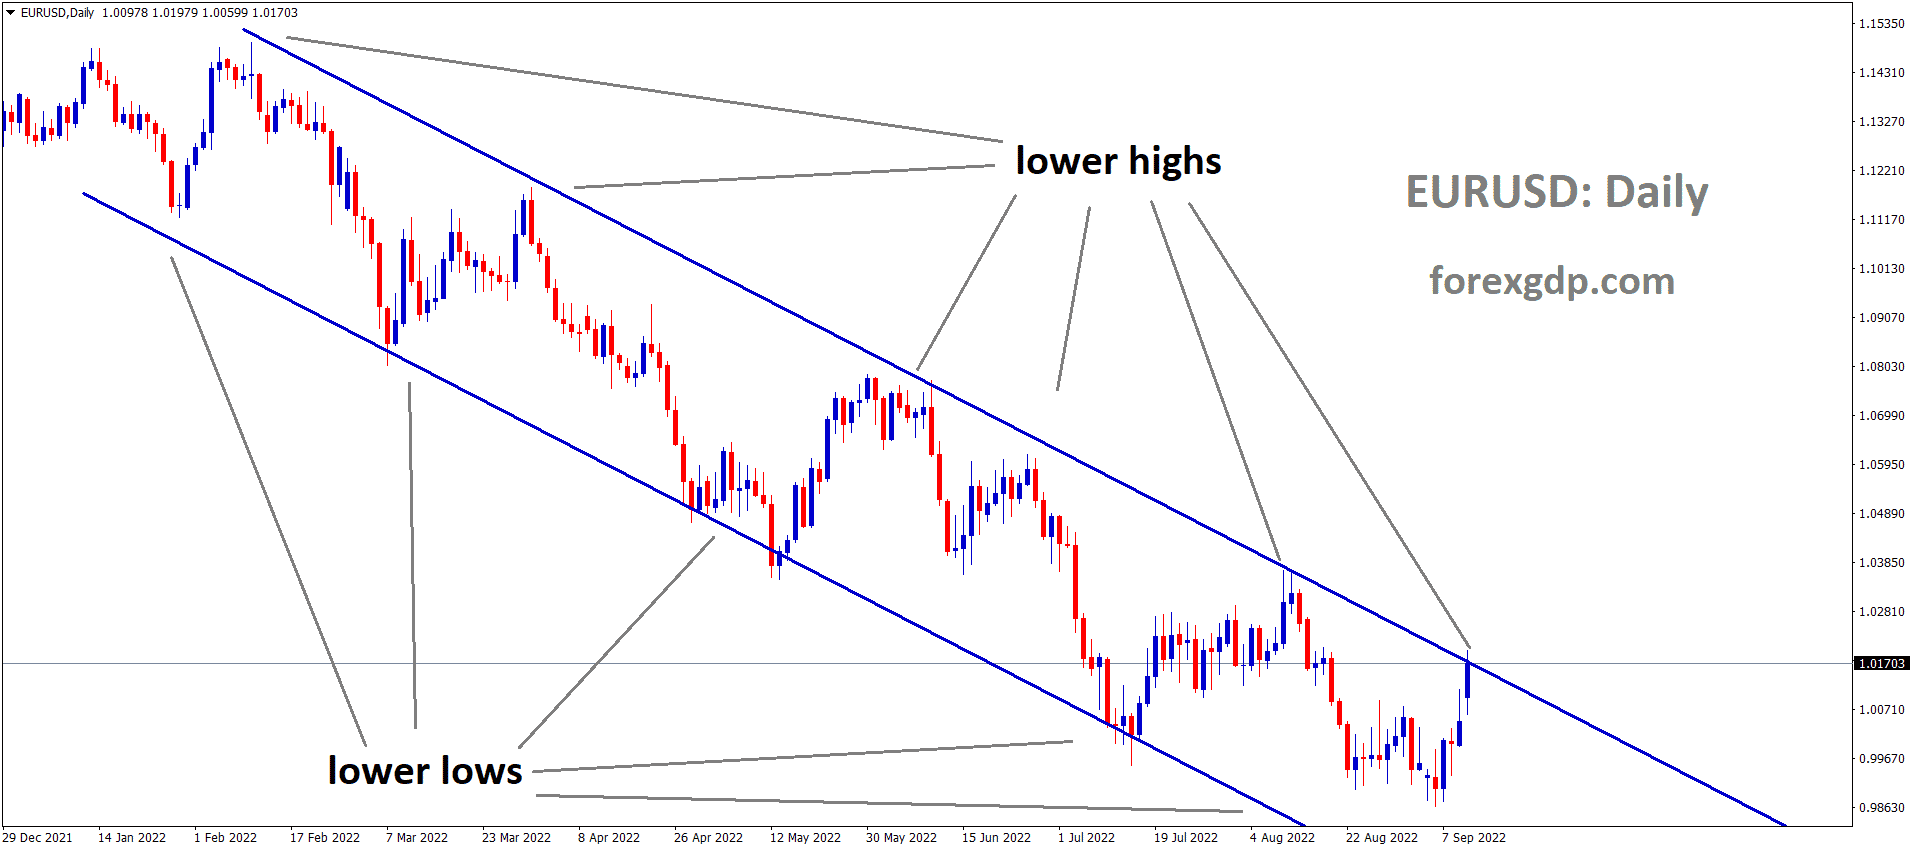
USDJPY is moving in a descending channel by forming lower highs, lower lows in the 30 minutes time frame chart.
Now, the top zone of the descending channel has broken with Buyers Pressure.
US Markets Gaining now
After a Extreme rally took US markets by hold in late-March, the Nasdaq gained as much as 88% over the next five months-and-change.
The Dow Jones Industrial Average was up by a more modest 60% but given that this was taking place as a global pandemic was taking the world by storm, it was still a very respectable number in a relatively short period of time.
The Treasury Department and Congress aiming the stimulus cannons at a problem, there’s likely to be some element of response. Given the fact that bond yields were incredibly low and the investing world had a dearth of alternative investment options, this rally might make a little more sense.
The Nasdaq is likely going to be the most operative focal point: The tech-heavy index gained a whopping 88% from the March lows up to that September first high, setting a fresh all-time-high in June and continued to chug along through July and August.
Get Each forex signal with Chart Analysis and Reason for buying or selling the trade which helps you to Trade with confidence on your trading account.
Don’t trade all the time, trade only at Best Setup. Join Free now. Let result speaks on your trading account. Start to receive the forex signals now: forexgdp.com/forex-signals/


