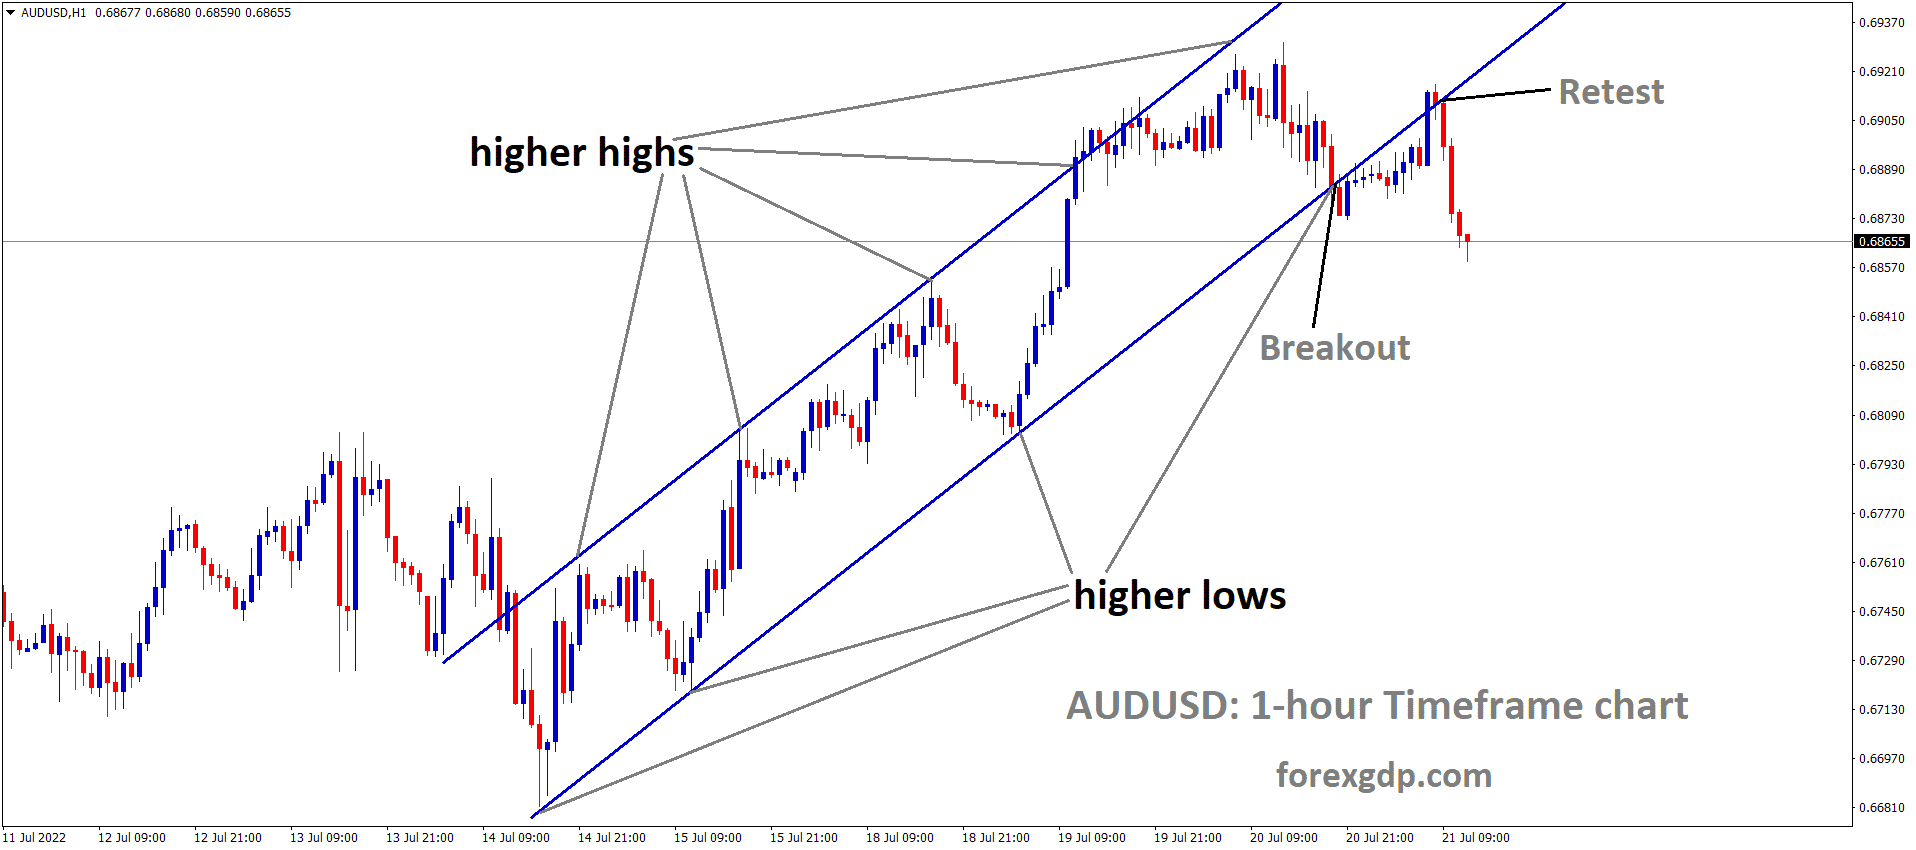
USDSGD Technical Chart Analysis
USDSGD has reached the support zone after a long time in the weekly time frame chart.
Let’s wait for the confirmation of reversal or breakout from this support zone.
If this support zone breaks, we can see a new landing at the next strong support.
Get Each forex signal with Chart Analysis and Reason for buying or selling the trade which helps you to Trade with confidence on your trading account.
Want to boost your profits? Get more trading signals at premium or supreme signal plan at an accurate time. Try now: forexgdp.com/forex-signals/


